


Consecutive Days
Table of Contents
- Understanding the Consecutive Days Filter
- Consecutive Days Filter Settings
- Using the Consecutive Day Filter
- FAQs
Understanding the Consecutive Days Filter
The consecutive days filter is a technical analysis tool used to identify stocks or assets that have experienced a streak of consecutive up or down days in their price movement. This filter focuses on the number of consecutive days the price has closed higher or lower than the previous day.
Here's how it typically works:
Definition of Consecutive Days: Traders specify the criteria for what constitutes consecutive days. For example, they may set the filter to identify stocks that have closed higher for at least three consecutive days or stocks that have closed lower for at least five consecutive days.
Identification of Patterns: The filter scans the stock market in real-time or within a specified time frame to identify instances where stocks meet the predefined criteria for consecutive up or down days.
Alert Generation: When the filter detects stocks with the specified consecutive days pattern, it generates an alert, notifying traders of potential trading opportunities.
These filter stocks based on the number of days in a row the stock has closed up for the day. This analysis is based completely on the closing price of the stock on a daily chart. This always starts with the close of the previous trading day, and works backwards from there.
- A stock closed yesterday afternoon at $10.00. It closed at 9.90 the day before. It closed at 9.80 the day before that. The preceding day it closed at 9.95. This stock has 2 up days.
- A different stock closed yesterday afternoon at $20.00. It closed at 20.10 the day before. It closed at 20.00 the previous day. This stock has 1 down day, or -1 up days.
- A third stock closed yesterday and the day before at $30.00 This stock has 0 up days.
Relevant scans: 6 or More Up Days, 5 Consecutive Up Days, 4 Consecutive Up Days, 3 Consecutive Up Days, 2 Consecutive Up Days, 1 Consecutive Up Day, 1 Consecutive Down Day, 2 Consecutive Down Days, 3 Consecutive Down Days, 4 Consecutive Down Days, 5 Consecutive Down Days, 6 or More Down Days.
Consecutive Days Filter Settings
The settings of each Trade Ideas filter are defined in the Window Specific Filters Tab located in the Configuration Window of your Alert/Top List Window. The user can fill in either or both of these values. Examples:
- Set Min Up Days to 3 to see only stocks which traded up for the previous three days, possibly more. This will only show stocks with a strong up trend.
- Set Max Up Days to -4 to see only stocks which traded down for the previous four days, possibly more. This will only show stocks with a strong down trend.
- Set Min Up Days and Max Up Days both to 2 to see only stocks which have traded up for exactly 2 days. This is useful for many trading strategies.
Using the Consecutive Day Filter
The consecutive days filter in stock trading can be used in conjunction with various trading strategies to identify potential opportunities in the market. Here are some strategies that traders commonly employ with the consecutive days filter:
Trend Reversal Confirmation: Traders use the consecutive days filter to confirm potential trend reversals. For example, if a stock has experienced a prolonged downtrend and the consecutive days filter identifies a series of upward closing days, it may indicate a reversal in the trend. Traders may then look for confirmation signals before entering a trade in the opposite direction.
Momentum Trading: Momentum traders use the consecutive days filter to identify stocks with strong upward or downward momentum. They look for stocks that have closed higher (or lower) for several consecutive days, indicating sustained buying (or selling) pressure. Momentum traders may then enter trades in the direction of the prevailing trend, aiming to capitalize on continued momentum.
Breakout Trading: Breakout traders use the consecutive days filter to identify breakout opportunities. They look for stocks that have closed higher (or lower) for a specified number of consecutive days, signaling a potential breakout from a trading range or consolidation pattern. Breakout traders may then enter trades in the direction of the breakout, aiming to profit from the continuation of the trend.
Pullback Trading: Pullback traders utilize the consecutive days filter to identify pullback opportunities within an existing trend. After a strong move in the direction of the trend, traders look for stocks that have closed lower (or higher) for a specified number of consecutive days, indicating a temporary retracement. Pullback traders may then enter trades in the direction of the overall trend once the pullback is complete.
Pattern Recognition: Traders use the consecutive days filter to identify specific chart patterns, such as flags, pennants, or triangles, which are formed by consecutive days of price movement. These patterns can provide valuable insights into future price movements and potential trade setups.
FAQs
How many consecutive days should I consider significant?
- Traders may wonder what constitutes a significant streak of consecutive days. The answer depends on the trader's strategy and timeframe. Some traders may focus on shorter streaks, such as three or five consecutive days, while others may look for longer streaks, such as ten or twenty consecutive days. It's essential to backtest different scenarios and adjust the criteria based on historical performance and risk tolerance.
What happens if there's a gap between consecutive days?
- Traders may be concerned about gaps in the consecutive days pattern, where the price does not close higher or lower for one or more days. While gaps can affect the continuity of the streak, traders often focus on the overall trend and consider the significance of the streak in context with other indicators and price action.
Should I use the consecutive days filter as a standalone indicator or in combination with other tools?
- Traders may wonder whether they should rely solely on the consecutive days filter or combine it with other technical indicators or trading strategies. While the consecutive days filter can be a valuable tool for identifying potential opportunities, it's often more effective when used in conjunction with other tools. Traders may incorporate additional indicators, such as moving averages, trendlines, or chart patterns, to confirm signals and improve overall trading accuracy.
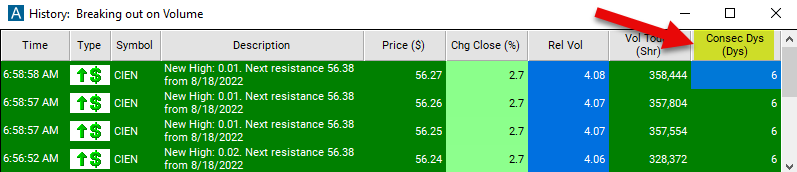
Filter Info for Consecutive Days [Up]
- description = Consecutive Days
- keywords = Changes Daily
- units = Days
- format = 0
- toplistable = 1
- parent_code =