


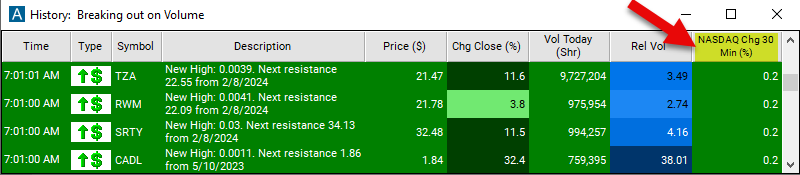
NASDAQ Change 30 Minute
Table of Contents
- Understanding the NASDAQ Change 30 Minute Filter
- NASDAQ Change 30 Minute Filter Settings
- Using the NASDAQ Change 30 Minute Filter
- FAQs
Understanding the NASDAQ Change 30 Minute Filter
This filter describes how quickly the market as a whole is moving, and in which direction.
This filter is different from most filters, because they are not specific to any one stock. At any given time all stocks get the same answer for this filter.
The NASDAQ Up filters track the changes in the NASDAQ 100. The S&P Up filters track the S&P 500. The Dow Up filters track changes in the Dow Jones Industrial Average.
These filters compare the current price of the index to the price 5, 10, 15, or 30 minutes ago. There is also a daily version which compares the current price to the previous day’s close. The historical price is always precise to the minute. The current price is based on the most recent print.
This filter is primarily meant for use with the OddsMaker and other forms of automated trading. This allows you to set up multiple types of strategies in advance. You can run some strategies when the market is going up, and others when the market is going down.
This filter is available before, after, and during regular market hours.
Here's how the "NASDAQ Change 30 Minute" filter works:
Real-Time Monitoring: The filter continuously monitors the price movements of stocks listed on the NASDAQ exchange in real-time, analyzing data over thirty-minute intervals.
Identification of Significant Changes: When the filter detects stocks that have experienced a significant change in price over the past thirty minutes, it generates an alert to traders. This alert indicates potential trading opportunities resulting from short-term price movements.
NASDAQ Change 30 Minute Filter Settings
The settings of each Trade Ideas filter are defined in the Window Specific Filters Tab located in the Configuration Window of your Alert/Top List Window. Use a positive number to see a market which is moving up. Use a negative number to see a market which is moving down. For example, set the max to 0.05 and the min to -0.05 to see a market which is very flat. Use a min of 0.15 to see a market which is moving up. Use a max of -0.15 to see a market which is moving down.
These filters are all measured in percent, not dollars. Some people use an index to watch the market. Other people use the futures, the e-mini futures, or an ETF. These will all have different values, but the percent change will be the same for all of them.
Using the NASDAQ Change 30 Minute Filter
Several trading strategies can be employed with the NASDAQ Change 30 Minute filter to capitalize on short-term price movements. Here are some common strategies:
Momentum Trading: Identify stocks that have experienced a significant price increase over the past thirty minutes. Enter long positions on these stocks, expecting the momentum to continue in the short term.
Pullback Trading: Wait for stocks that have experienced a sharp decline in price over the past thirty minutes, indicating a potential pullback. Enter long positions if the stock shows signs of stabilizing or reversing its downward trend.
Breakout Trading: Look for stocks that have broken out of a trading range or consolidation pattern with a significant price increase over the past thirty minutes. Enter long positions if the breakout is confirmed, expecting the stock to continue moving in the breakout direction.
Reversal Trading: Identify stocks that have experienced a sudden reversal in price direction over the past thirty minutes. Enter positions opposite to the recent price movement, expecting the stock to retrace or reverse its recent trend.
FAQs
How does the NASDAQ Change 30 Minute filter work?
- The NASDAQ Change 30 Minute filter monitors stocks listed on the NASDAQ exchange in real-time, analyzing price movements over thirty-minute intervals. It identifies stocks that have experienced significant price changes within this timeframe, generating alerts for potential trading opportunities.
Can I use the filter for both long and short trades?
- Yes, the NASDAQ Change 30 Minute filter can be used to identify both long and short trading opportunities based on the direction of significant price changes.
Can the filter be used in conjunction with other technical indicators?
- Yes, traders often combine the NASDAQ Change 30 Minute filter with other technical indicators, such as moving averages, RSI (Relative Strength Index), or MACD (Moving Average Convergence Divergence), to validate signals and enhance trading decisions. Using multiple indicators can provide a more comprehensive analysis of market conditions and increase the reliability of trading signals.
Filter Info for NASDAQ Change 30 Minute [Qqqq30]
- description = NASDAQ Change 30 Minute
- keywords = Fixed Time Frame
- units = %
- format = 1
- toplistable = 1
- parent_code = Qqqq5