


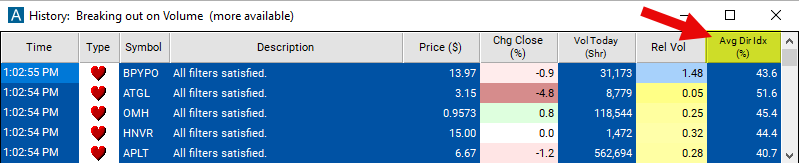
Average Directional Index
Table of Contents
- Understanding the Average Directional Index Filter
- Average Directional Index Filter Settings
- Using the Average Directional Index Filter
- FAQs
Understanding the Average Directional Index Filter
The Average Directional Index (ADX) is a technical analysis indicator used to quantify the strength of a trend in the stock market. Here’s a brief explanation:
Components: The ADX is part of the Directional Movement System, which also includes the +DI (Positive Directional Indicator) and -DI (Negative Directional Indicator). The +DI and -DI help determine the direction of the trend, while the ADX measures the trend's strength.
Calculation: The ADX is a smoothed moving average of the expansion of the range between the +DI and -DI.
Reading the ADX:
- Values below 20 indicate a weak trend.
- Values between 20 and 40 suggest a strengthening trend.
- Values above 40 indicate a strong trend.
The direction of the trend is determined by the +DI and -DI. If +DI is above -DI, the market is considered to be in an uptrend, and vice versa. The ADX is valuable for traders looking to identify when a trend is strong enough to warrant trading strategies that capitalize on following the trend.
These look at a daily chart and use a 14 period smoothing factor.
Average Directional Index Filter Settings
The settings of each Trade Ideas filter are defined in the Window Specific Filters Tab located in the Configuration Window of your Alert/Top List Window.
Here is how to setup the filter in your configuration window:
- Set the min value to 40 to see only stocks with a strong ADX.
Using the Average Directional Index Filter
Several trading strategies can be employed with the Average Directional Index filter. Here are a few examples:
Trend Confirmation Strategy: Use the ADX to confirm if the market is trending by waiting for it to rise above a threshold (commonly 20 or 25). This confirmation helps decide when to employ trend-following strategies, with the direction of the trend indicated by the +DI and -DI lines.
Trend Strength Strategy: Gauge the strength of a trend by monitoring changes in the ADX. An increasing ADX suggests growing trend strength, which could indicate a good opportunity to enter or maintain positions. A declining ADX indicates weakening trend strength, potentially signaling a time to exit.
Volatility Management: Adjust stop-loss orders based on the trend's strength as indicated by the ADX. In strong trends (high ADX), consider setting wider stop-losses to stay in the trade through normal market fluctuations. In weaker trends (low ADX), tighter stop-losses can help in managing risk more effectively.
FAQs
What does the ADX tell you about market conditions?
- The ADX measures the strength of a trend but does not indicate its direction. A high ADX value (above 25) suggests a strong trend, either up or down, while a low ADX value (below 20) indicates a weak trend or a ranging market.
How can the ADX improve my trading strategy?
- The ADX can improve your trading strategy by helping you identify strong trends to trade with, thereby potentially increasing your profitability. It also helps in avoiding trades in weak or ranging markets, reducing the likelihood of entering losing trades.
Is the ADX better in a specific time frame?
- The ADX can be used in any time frame, but its effectiveness may vary depending on the market and the trading strategy. Day traders might prefer shorter time frames (like 15-minute or 1-hour charts), while swing traders or investors might look at daily or weekly charts. Experimentation and backtesting are key to finding the most effective time frame for your strategy.
Filter Info for Average Directional Index [ADX]
- description = Average Directional Index
- keywords = Changes Daily
- units = %
- format = 1
- toplistable = 1
- parent_code =