


20 Period SMA Crossed Below 200 Period SMA (5 Minute)
Table of Contents
- Understanding the 20 Period SMA Crossed Below 200 Period SMA 5 Minute Alert
- Default Settings
- Description Column
Understanding the 20 Period SMA Crossed Below 200 Period SMA 5 Minute Alert
These alerts report when one intraday SMA (simple moving average) crosses another. The server is constantly monitoring for a 20 period SMA crossing a 200 period SMA.
When a shorter term SMA crosses below a longer term SMA, most people call that a bearish signal. We report that case in red.
The server watches for these alerts in the 2, 5, and 15 minute time frames. Notice the large red number in each icon. This is the number of minutes in the time frame.
The longer term SMAs (20 vs. 200) are usually used to describe longer trends.
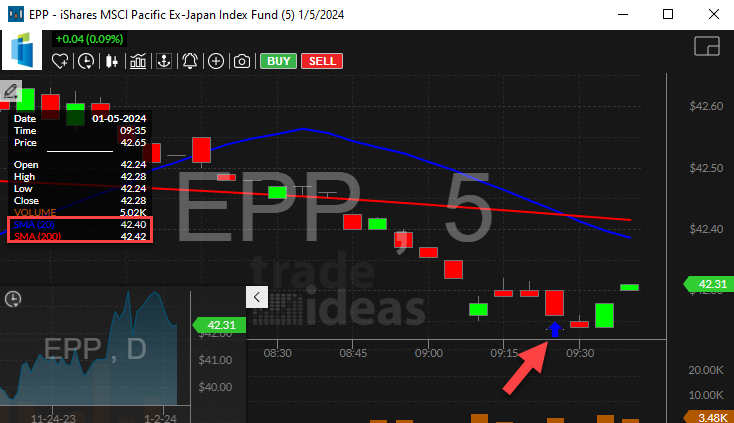
Like all analytics based on intra-day candles, the exact values of these formulas can vary from one person to the next. However, SMAs are naturally very stable. If the alert server reports a crossing, it is safe to say that the two SMAs are touching or at least very close. This alert condition will be easier to see on a chart if the stock is moving quickly; the SMAs for slower moving stocks often seem to overlap for a long time on a chart.
The server always reports crossings at the end of one candle and the start of the next.
Benefits of the "20 Period SMA Crossed Below 200 Period SMA" alert include:
Long-Term Trend Reversal Identification: It can serve as an early indication of a potential reversal in the long-term trend, signaling a shift from an uptrend to a downtrend.
Confirmation of Bearish Momentum: The crossover of the shorter-term SMA below the longer-term SMA may confirm bearish momentum in the market, suggesting that recent price movements are strong enough to influence the long-term trend negatively.
Investment Decision Signal: Investors often use this type of crossover to make decisions about longer-term investment strategies, such as exiting or reducing long positions in stocks.
Objective Trading Signal: Similar to other moving average crossovers, this alert provides an objective signal based on specific criteria, aiding in systematic decision-making.
Default Settings
By default, this alert is triggered when the 20 period SMA crosses below the 200 period SMA in a 5 minute timeframe. To align with each alert, it's essential to utilize the corresponding time frame on the chart. For instance, this 20/200 crossover alert is visualized on the 5-minute candlestick chart.
Description Column
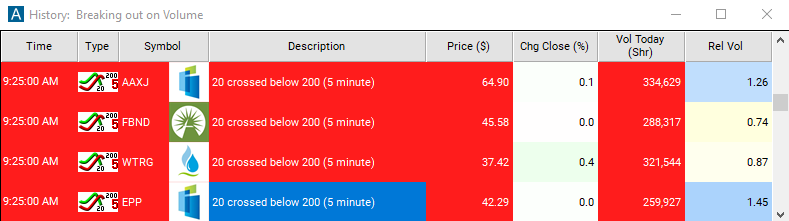
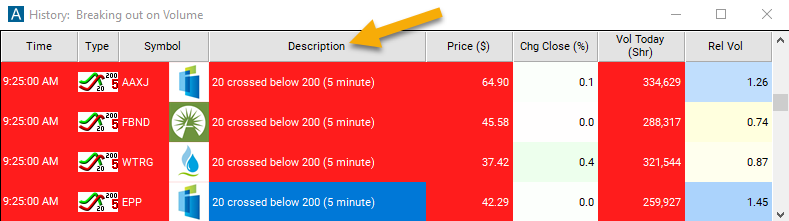
The description column of this scan will display "20 Crossed Below 200 (5 Minute)", providing you with a clear indication of the specific alert that has been triggered.
Alert Info for 20 Period SMA Crossed Below 200 Period SMA (5 Minute) [YCBD5]
- description = 20 period SMA crossed below 200 period SMA (5 minute)
- direction = -
- keywords = End Of Candle Moving Average Fixed Time Frame
- flip_code =
 20 period SMA crossed above 200 period SMA (5 minute) [YCAD5]
 - parent_code = X5A8_1