


Trailing Stop, % Down
Table of Contents
- Understanding the Trailing Stop Percentage Down Alert
- Default Settings
- Custom Settings
- Description Column
Understanding the Trailing Stop Percentage Down Alert
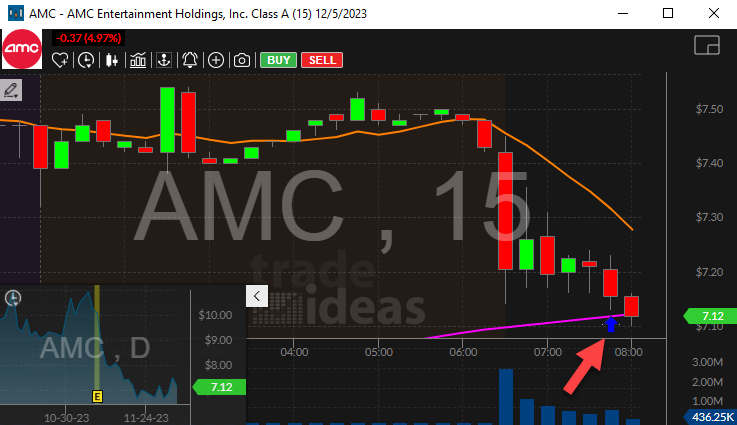
This alert is based on the idea of a trailing stop. It will report when a stock price pulls back from a local high or low. These highs and lows can happen on any time frame, they are not limited to candles of any particular size.
A trailing stop is a feature of many trading applications which helps you lock in profits. The software will watch each of your positions. Each time one of your long positions goes up, the software adjusts your stop loss. If the prices moves back down a predetermined amount, you will hit the stop loss, and the software will automatically sell your stock. The software constantly compares the current price of each of your long positions the highest price since you owned the stock. Short positions work the same way, but the direction is reversed.
Trade-Ideas does not know when you buy or sell a stock, so we can not replace a stop loss. However, we can approximate your stop losses. To do this we assume that you always buy stocks when they are going up, and short them when they are going down.
The trailing stop alerts are similar to the pullbacks from highs and lows, and the Fibonacci retracements. All of these alerts report when a stock moves in one direction, then turns around and moves sufficiently far in the other direction. Trailing stops are different because they work on a shorter time scale and typically report more often. For the pullbacks from highs and lows, the turning point must be a new high or low for the day. For the Fibonacci retracements, the turning point must be a volume confirmed support or resistance line. Trailing stop alerts, like real trailing stops, will allow even a single print to serve as the turning point.
The first trailing stop alert will occur when the stock moves at least 0.5% down from the last high or up from the last low. The stock will produce another alert each time the stock continues in that direction for another 0.25%.
The there are three common ways to use these alerts. If you are watching your stocks very closely, you can use these alerts similar the way you'd use a real trailing stop. You can have one alert window generate stop loss alerts whenever your long positions move down, and have another window generate stop loss alerts whenever your shorts move up.
For more general information you can put the up and down alerts into the same window and watch all of your stocks. This acts a lot like a standard stock ticker. The difference is that most stock tickers list the stocks as red or green depending only on whether they are up or down for the whole day. These alerts to show you which stocks are up or down for a shorter time frame, and you can configure them to adjust that time frame.
If you use real trailing stops in your trading, these alerts can help you determine the best values to use for these stops. Often when you use a trailing stop you are surprised how quickly you are stopped out. Traditional backtesting tools are not precise enough to simulate a trailing stop. If an up candle is very tall, does that mean that the stock went straight up? Or did it move back and forth a lot in the middle of the candle? Use these alerts with our history feature to see just how much a stock typically moves around in these smaller time frames.
Default Settings
By default, the Trailing Stop, % Down alert appears when the stock moves down at least 0.5% up from the last high. The stock will produce another alert each time the stock continues in that direction for another 0.25%.
Custom Settings
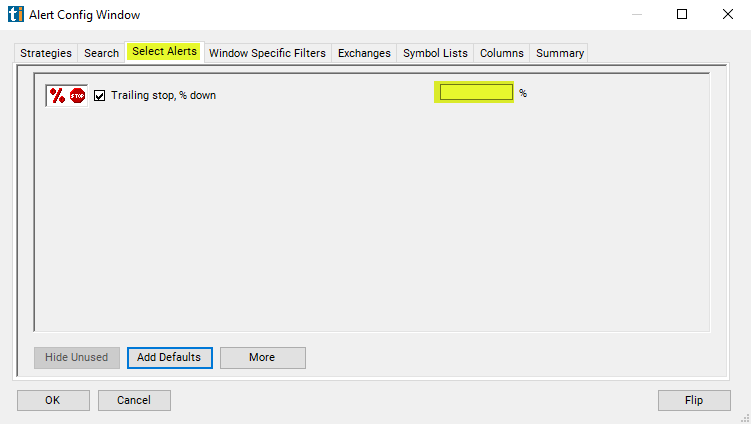
For 'Trailing Stop, % Down' alerts, you have the option to use an alert specific filter. This filter is located immediately to the right of the corresponding alert and is always optional. You can decide to leave it blank if you want to receive more alerts, or you can fill it in to restrict the number of alerts you receive. This filter allows you to specify the quality of the alert. When you set a higher number for this filter, you are telling the alerts server to display only alerts that meet a higher quality standard, resulting in fewer alerts being shown.
When setting an alert for 'Trailing Stop, % Down', the user can filter the alert by increasing the period to see fewer alerts. The Trailing stop alerts are all periodic alerts. They each repeat on a regular basis. Assume for, a simple example, that a stock continuously moves down all day. By default you will see another Trailing stop, % down alert every time the stock moves down another 0.25%. For example, you might only want to see these alerts each time the stock moves 0.5%, or each time it moves 1% or 2%. Each of these will show you alerts less frequently, but you will still see alerts spread throughout the day.
The basic idea is that the size of the move has to be a multiple of the value in the filter. For example, if you set the filter to 2, you will only see the percentage based alerts when the stock moves 2%, 4%, 6%, 8%, etc.
You can put other numbers into this filter. For example, you can put in a value of 0.33333 if you want to see each time a stock moves 1/3 of one percent. The server does not actually produce alerts when a stock moves 1/3 of a percent. But, if you select this value, we show approximately the same number of alerts as you would see if we did display alerts at that exact value. This allows you to adjust the speed at which alerts are displayed to match your tastes.
This filter is designed primarily for people using these alerts to make a ticker. This shows you how quickly stocks are moving, and in what direction. It's good for getting an overview of a lot of stocks.
We do not recommend using this filter if you are trying to debug your trailing stops. These alerts are much more precise if you leave this filter blank.
Description Column
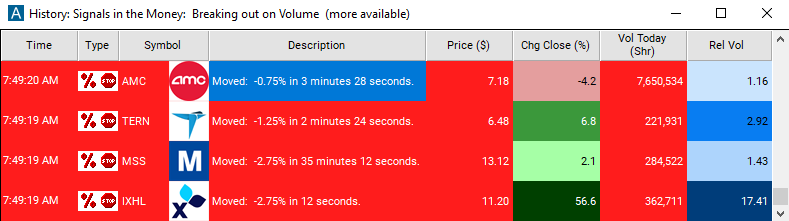
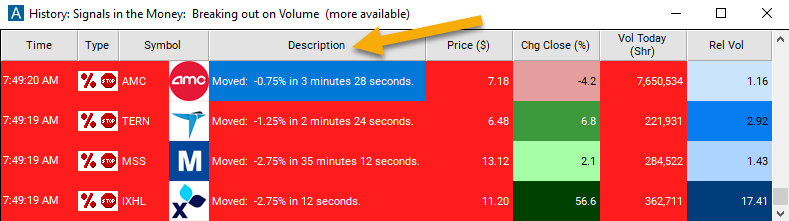
The alert description will provide real-time information on the stock's percentage decrease within a specific time frame.
Alert Info for Trailing Stop, % Down [TSPD]
- description = Trailing stop, % down
- direction = -
- keywords =
- flip_code =
 Trailing stop, % up [TSPU]
 - parent_code = TSPU