


60 Minute Low
Table of Contents
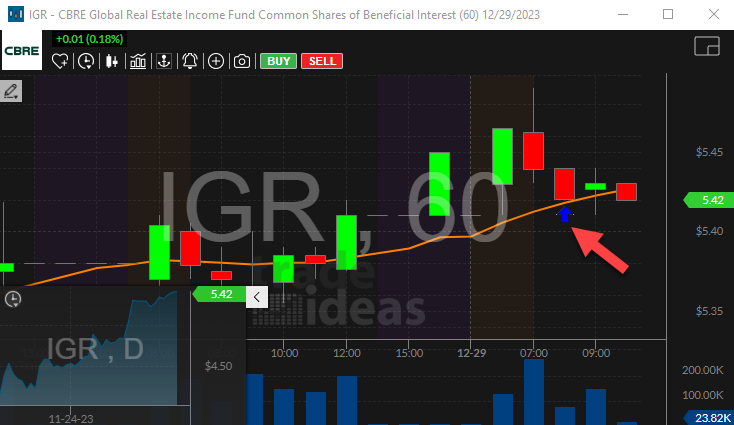
Understanding the 60 Minute Low Alert
This alert reports when a stock makes a new intraday low. This alert is defined in terms of a standard candlestick chart. Look at the current candle that is building for a stock, and compare that to the previous candle. The first time that the current candle goes below the low of the previous candle, we report a new low. We ignore candles with no volume; we always go back to the last candle representing at least one trade.
This alert is based strictly on traditional candlestick analysis. This alert only looks at price and time, and it does not filter out bad prints. Most of our alerts take volume, spread, and volatility into account. This trade-off makes this alert slightly easier to understand than most of our alerts, but much noisier.
This alert can serve the purpose of a trailing stop. It constantly tells you when the stock price pulls back in one direction or the other. The best way to use this alert is to apply it to your current portfolio so you know if one of your positions is moving away from you.
Default Settings
By default, the 60 minute low alert appears when the price of a stock makes a new intraday low on a 60 minute candlestick chart.
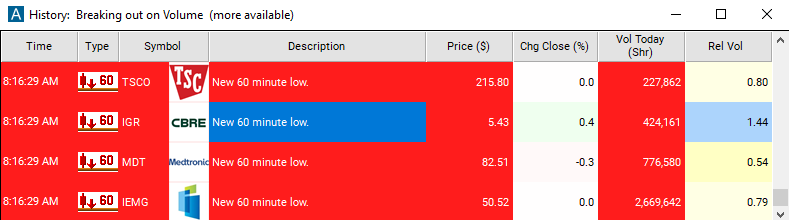
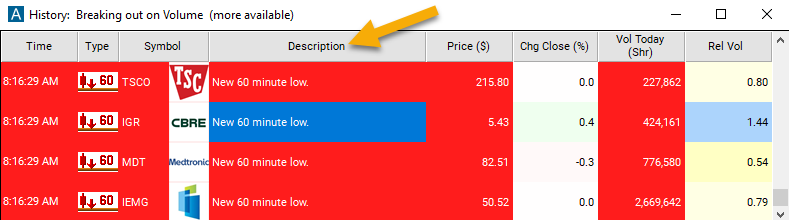
Description Column
The description column of this scan will display "New 60 Minute Low," providing you with a clear indication of the specific alert that has been triggered.
Alert Info for 60 Minute Low [IDL60]
- description = 60 minute low
- direction = -
- keywords = Fixed Time Frame
- flip_code =
 60 minute high [IDH60]
 - parent_code = IDH5