


Broadening Bottom
Table of Contents
- Understanding the Broadening Bottom Alert
- Default Settings
- Custom Settings
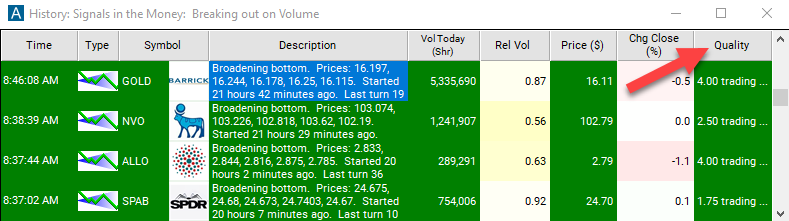
- Description Column
- Quality Column
Understanding the Broadening Bottom Alert
The broadening pattern, also called the inverted triangle pattern, is a common pattern in technical analysis. This pattern is defined as a series of higher highs and lower lows. It takes at least 5 consecutive highs and lows in this pattern before we report it.
A broadening bottom alert means that the price touched the bottom of the pattern, then turned back up.
These are part of a series of alerts all based on local highs and lows. Compared to most of our alerts, these alerts have longer terms and are based on more complicated chart patterns. These patterns take longer to see, but they also last longer.
The analysis for these alerts starts with our standard volume confirmation. This allows us to see which price trends are significant, and which prints should be filtered out. You need more than just a price trend to define a high or a low. You need significant volume below a high price, just to set a baseline. Then you need significant volume near or at the high price to define the high price. Finally, you need significant volume below the price, again, to show that the trend has reversed itself and the price has turned around. Lows are defined similarly. After you have a series of these turning points, you can see the patterns described in these alerts.
The description of each alert lists the prices of the highs and lows that formed the pattern. This includes our normal algorithm for removing stray prints. This shows the most extreme prices where more than a trivial amount of volume occurs. In some cases, this price is an average of several prints, if no one print described the turning point adequately.
The description also includes the times when the pattern started and ended. As a result of the smoothing and confirmation, the times are not as precise as the prices. This is particularly obvious with NASDAQ stocks. Often a significant turning point will occur between one day's close and the following trading days open. The alert will attempt to find the exact turning point, but since trading gradually trails off in the evening, and gradually picks up in the morning, there may be no specific point in time. The alert will just give its best estimate between the open and the close. For NYSE stocks, the open is much more precise, so these alerts will often list the open as the exact starting time.
We report only the times when the stock was at the first high or low price and the when the stock was at the last high or low price. The definition of these alerts requires the stock price to move in a certain direction before and after this to define a turning point. We don't include this additional period in the time.
Each of these alerts can be filtered based on the volume inside the pattern. Like the times, we only include volume between when the stock was at the first high or low and when the stock was at the last high or low. We do not include the volume before and after these turning points.
Default Settings
By default, the 'Broadening Bottom' alert will appear when a stock takes 5 consecutive highs and lows, hits the bottom of the pattern, and then heads back up.


Custom Settings
For 'Broadening Bottom' alerts, you have the option to use an alert specific filter. This filter is located immediately to the right of the corresponding alert and is always optional. You can decide to leave it blank if you want to receive more alerts, or you can fill it in to restrict the number of alerts you receive. This filter allows you to specify the quality of the alert. When you set a higher number for this filter, you are telling the alerts server to display only alerts that meet a higher quality standard, resulting in fewer alerts being shown.
When setting an alert for 'Broadening Bottom', the user can filter the alert by hours traded.

Normally there are 6.5 hours between the open and the close. But, what about premarket and post market?
If I see a pattern that lasted from noon yesterday to noon today, is that any better than a pattern that lasted from the open this morning to the close this afternoon? How much better? We weight the pre and post market according to volume. On an average day an average NASDAQ 100 stock will trade roughly 1 hour's worth of volume between the close and the following open. If you want to see stock patterns that lasted for a whole day, a good estimate is 7.5 hours, 6.5 for normal hours plus 1 for the pre and post market.
The same rules apply during the day. If a chart pattern lasts for one hour starting from the open, it will almost always be considered a stronger pattern than if it lasted one hour starting from the beginning of lunch. Hours are just an estimate. Volume is the major factor in this filter. Stocks trading on higher than average volume will satisfy this filter faster than stocks trading on lower than average volume.
Description Column
The description of each alert lists the prices of the highs and lows that formed the pattern. It also includes the times of when the pattern started and ended.

Quality Column
The quality value on a scan using the 'Broadening Bottom' alert defines the number of hours since the measured pattern has been established.
Alert Info for Broadening Bottom [GBBOT]
- description = Broadening bottom
- direction = +
- keywords = Geometric Pattern Volume Confirmed
- flip_code =
 Broadening top [GBTOP]
 - parent_code =