Traders’ Tips
January Issue

“Things may come to those who wait, but only the things left by those who hustle.” Abraham Lincoln
For this month’s Traders’ Tips, we’ve provided a strategy that came from our support forum but inspired by Oscar Cagigas’ article, The Megan Ratio. Our inspiration comes from the same question, “Which system will generate more return?” but this article won’t be so heavy on the math and equations.
The following strategy aims to find and profit from a V-Bottom pattern. Then using the OddsMaker, Trade-Ideas’ backtesting tool, we derive the optimum hold time and stop loss.
 Here is a
picture of the strategy’s configuration within Trade-Ideas PRO:
Here is a
picture of the strategy’s configuration within Trade-Ideas PRO:
STEP 1: How to create a V-Bottom pattern recognition
strategy
Use the short term “Running up now” alert as the trigger. Set the alert specific filter to $.35 meaning that the stock has to move up at least $.35 cents in the last minute to appear in the results.
STEP 2: Draw the V
part of the pattern using filters
To make sure every alert like the V-Bottom pattern we use the “Position in range” filter set to a maximum of 5%. This means that the “Running up now” alert will only be triggered if it does so in the lower 5% (percentile) of the stock’s daily trading range. In this particular example we also added a “Maximum price” filter of $150 to limit ourselves to stocks we could potentially trade with some size. In addition we added the “Min average daily volume” filter set to 100,000; a “Maximum spread” filter of 10 cents and the “Maximum Distance from Inside Market or Unusual bad market data” filter to avoid alerts triggered by bad prints.
The definitions of this alert and these filters appear here: http://www.trade-ideas.com/Help.html.
Here is the strategy you can copy into the ‘Collaborate’ feature
of TI PRO: http://www.trade-ideas.com/View.php?O=20000000000000000000000000000000000000000000000000000000_1D_0&QRUN=0.35&MaxDNbbo=1&MaxPrice=150&MaxRD=5&MaxSpread=10&MinVol=100000&WN=Trading+the+V+Bottom
STEP 3: OddsMaker Analysis. Creating the Backtest
In the tradition of V-Bottoms we are looking to buy or go long the stocks that appear in this strategy. After taking several time options we optimized that the best hold time was 30 minutes meaning we would exit this trade 30 minutes after we entered the position or sooner if we were stopped out.
Risk
Management:
Today’s market is more volatile than most traders are use to. What that means is you can no longer trade stocks and have arbitrary 10, 15, or 20 cent stops. The range of stock movement is much more exaggerated. To compensate Trade-Ideas invented a proprietary stop loss metric called “the Wiggle”. The wiggle takes the average 15 minute volatility and multiplies it by the relative volume at the time of the alert. That means that for every stock you have a unique, statistically valid stop. In Figure 2 you see the stop loss of 1 penny + the wiggle.
Start and Stop:
This strategy runs the whole day looking for matching opportunities. That is why there are zeros in the Entry Time fields (e.g., Start, End) in Figure 2.
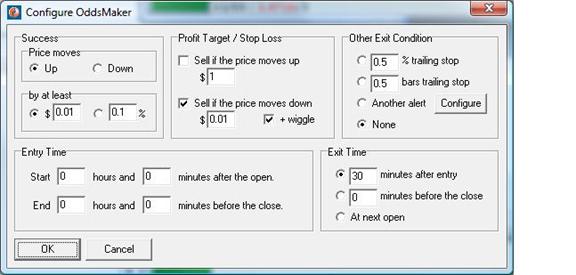
Figure 2: The OddsMaker backtesting
configuration for ‘Trading the V-Bottom’
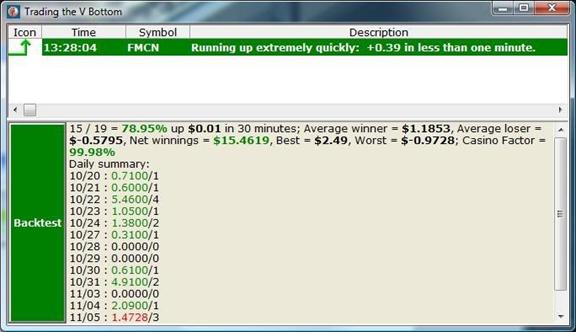
Here is a summary of what the OddsMaker said given the following
trade rules:
- On each alert, buy
long
- Sell the stock if
price moves down $0.01 plus its wiggle
- Otherwise hold the
stocks for no more than 30 minutes
- Start trading when the
market opens
- Stop new trades at the
end of the session
Figure 3 is a picture of the results (last backtested for the period of 10/20/2008 to 11/5/2008): 15 out of 19 possible trades were winners – with an average winner to average loser ratio almost 2X.
Figure 3: The OddsMaker results for ‘Trading the
V-Bottom’