4 Advanced Charting Techniques for Day Traders
4 Advanced Charting Techniques for Day Traders
By: Shane Neagle
For day traders active in the faced-paced world of the market, learning advanced charting techniques is crucial. These help traders to have a more thorough comprehension of how the market changes, helping them in making better choices with accuracy. When these strategies are used by traders, they help to forecast where the market will move, and improve their methods for entering and exiting trades. This article will discuss four advanced charting techniques that every day trader should know: the Ichimoku Cloud, Heikin-Ashi Candlesticks, Volume Profile and Fibonacci Retracement. Including these strategies in your trading plan could improve overall performance whilst also making it easier to handle market intricacies.
Fibonacci Retracement
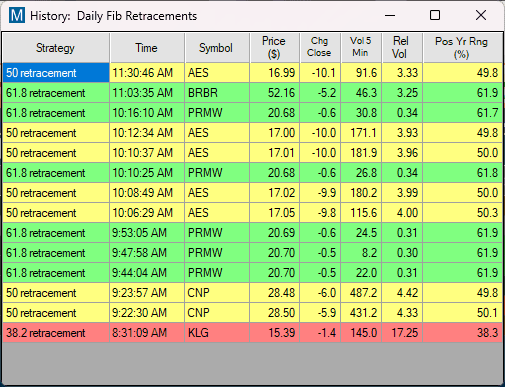
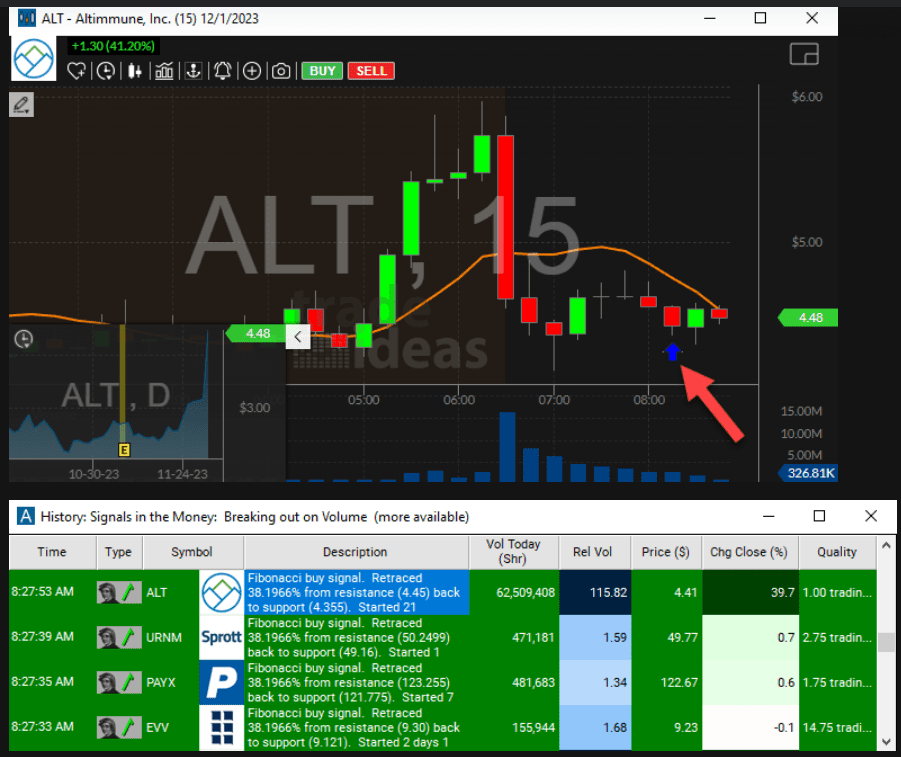
One common technique in technical analysis that traders use to identify possible market support and resistance levels is referred to as Fibonacci retracement. This method involves the utilization of ratios derived from the Fibonacci sequence, a numerical series frequently observed in patterns occurring within nature. The number itself is equivalent to the addition of two numbers before it in the sequence. For trading purposes, ratios such as 23.6%, 38.2%, 50%, 61.8% and even a whole number like 100% are commonly employed in Fibonacci techniques. These percentages could assist you to estimate the extent of possible decline in price prior to its upward movement beginning again.
The main concept of Fibonacci retracement is that markets usually reverse partially before continuing in the same direction as before. Traders choose high points and low points on the price chart to use this tool. The lines going across the chart are made by dividing the vertical distance between these spots by the Fibonacci ratios. These horizontal lines show possible places where prices might change direction, acting as support or resistance levels.
For instance, if a stock price climbs from $100 to $200, the Fibonacci retracement levels would be calculated as follows:
23.6% retracement at $176.40
38.2% retracement at $161.80
50% retracement at $150.00
61.8% retracement at $138.20
Before the market starts going up again, traders watch these levels carefully to spot any changes in price direction. When the market goes back to the upward trend, traders see a pullback to one of these levels as a sign for opening a long position. If the price drops below these points, it could indicate a change, and investors might decide to sell their stock or bet on the price going down.
Essentially, if traders use Fibonacci retracement levels as part of their trading plan, they’ll probably do better because they’re making smarter choices about when to trade.
Ichimoku Cloud
The Ichimoku Cloud, also named Ichimoku Kinko Hyo, is a powerful tool for technical analysis that helps traders see support and resistance levels clearly, understand trend direction better, and measure market momentum. A Japanese journalist called Goichi Hosoda invented this indicator. It has five main parts: Tenkan-sen, Kijun-sen, Senkou Span A, Senkou Span B, and Chikou Span.

The Tenkan-sen, or Conversion Line, is found by averaging the highest high and lowest low over nine periods. This part shows short-term trend direction and gives an idea of market momentum. The Kijun-sen, which people also call the Base Line, is figured out in a similar way but uses 26 periods. It shows the direction of medium-term trends.
Senkou Span A, which is also called Leading Span A, means the average value of Tenkan-sen and Kijun-sen. This is shown 26 periods in front on the chart. Senkou Span B, or Leading Span B, calculated by taking the highest high and lowest low values from past 52 periods’ average. It’s also plotted at 26 periods on the chart as well. The space that is between Senkou Span A and Senkou Span B makes the “cloud” (Kumo), showing possible support and resistance areas. The Chikou Span, or Lagging Span, shows today’s closing price but plotted 26 periods earlier; this helps to see past support and resistance levels.
By putting these parts together, the Ichimoku Cloud gives a clear picture of the market. If the price is above the cloud, it means the market is going up; if the price is below the cloud, it shows a downtrend. The cloud itself works like flexible support and resistance, where thicker clouds mean stronger levels.
Traders use Ichimoku Cloud to find good times for trading and handle risk by watching when lines cross and where the price is in relation to the cloud. A bullish sign happens when Tenkan-sen goes above Kijun-sen, especially if the price stays above the cloud. Conversely, a bearish signal happens when the Tenkan-sen moves under the Kijun-sen and the price stays below the cloud.
The Chikou Span gives more proof of the trend direction. If it’s higher than the price from 26 periods before, it means a bullish view; if it’s lower, it shows bearish momentum. And by combining these signals, traders can make smart choices about when to enter or leave trades, helping them handle risk better.
The Ichimoku Cloud offers a broad method for looking at market trends, which makes it useful for traders who want to comprehend how markets move and improve their trading plans.
Heikin-Ashi Candlesticks
Heikin-Ashi candlesticks provide a unique method for drawing charts that helps traders to easily observe market trends by smoothing price data and lessening the impact of superfluous fluctuations. Instead of using regular candlestick charts, which show open, high, low close prices for every time period – Heikin-Ashi applies an alternative way to calculate its values. This method calculates the average price numbers, creating a picture which displays trends and makes it simpler to identify potential changes in direction.

In Heikin-Ashi charts, the calculation for each candle differs from traditional methods:
- Open Price: Calculated as the average of the open and close prices of the previous candle.
- Close Price: Determined as the average of the open, high, low, and close prices for the current period.
- High Price: The highest value among the high, open, or close for the current period.
- Low Price: The lowest value among the low, open, or close for the current period.
This technique creates charts that are better at displaying trends and reducing market distractions. For instance, when there is a strong upward trend, Heikin-Ashi candles typically don’t feature lower wicks. This indicates the ongoing climb in motion. Conversely, in a market that is going down, typically candles don’t show upper wicks. This signifies consistent selling pressure. When these patterns change and you see lower wicks during an ascending trend, it could suggest that the trend might reverse soon.
Traders frequently incorporate Heikin-Ashi charts along with other indications to enhance their trading approaches. They may, for example, examine Heikin-Ashi charts in order to perceive the general trend’s direction and simultaneously employ the RSI for verifying whether a market is experiencing considerable buying or selling pressure. The combination of these signals could assist in making better decisions about trades such as when one should enter or exit an investment.
Generally, for traders who want a smoother view of market trends and shifts, Heikin-Ashi candlesticks can be beneficial. This method lessens the impact of minor price swings and assists traders in improving their decision-making process and overall trading performance.
Volume Profile
Volume Profile shows trading activity during a chosen time period at different price levels, unlike usual volume indicators that only display volume over time. Volume profile gives traders detailed information about how much was traded at each price level, helping them find important price points and areas with high activity.
Volume profile shows the volume of trades made at each price level like a graph on the side of a price chart. This graph makes it easy to see where there was more or less trading, called high volume nodes (HVNs) and low volume nodes (LVNs). HVNs show price points where lots of trading happened, meaning strong support or resistance there. On the other hand, LVNs are price points without much trading activity; these often work like pivot areas where prices can change fast.
Traders use volume profiles to understand the market structure better and plan trades with more precision. By looking at how trading volume is spread out, traders can find important levels where a price may have had trouble moving before. These levels can show good places to enter or exit trades. For example, if there is a high volume node, it might act as a support level when prices are falling. This can be a good time for traders to buy. In the same way, low volume nodes could show a resistance level when prices are rising, meaning it might be a good point to sell.
Volume profile also helps to see possible price moves. When the price gets close to a HVN, it might slow down or turn around because there is lots of trading activity at that spot. On the other hand, prices can change quickly through LVNs because there is not much trading happening to slow it down or hold it up. Knowing this helps traders to predict and respond to price changes in a smarter way.
Conclusion
For day traders wanting to make their strategies better and improve how they decide, learning advanced charting methods is important. Using tools like Fibonacci Retracement, Ichimoku Cloud, Heikin-Ashi Candlesticks, and Volume Profile can give a deeper knowledge of market actions and aid in finding key trading opportunities with precision.
Each technique has its own special advantages. Fibonacci Retracement shows possible support and resistance levels, while the Ichimoku Cloud gives a clear view on market trends and direction. Heikin-Ashi candlesticks help to remove market noise so trends are easier to see. Volume Profile shows key price levels and areas where trading activity is high.
By adding these new charting techniques into your trading strategy, you can improve how you handle market challenges. Regular practice and learning are important to become skilled with these tools, helping you stay flexible and successful in the quick-moving world of day trading.