The Power of Filter Histograms
The Power of Filter Histograms
Last week, we discussed my gap trading strategy and the capability of Trade-Ideas to normalize gaps using volatility.
That’s a nice segue into this week’s subject: one of my favorite, yet lesser-known, features in Trade-Ideas – Filter Histograms.
Let’s take a look at one of the filters I frequently use across the 15+ trading strategies that I implement daily: the ATR or Average True Range.
ATR represents the average amount that a stock moves in a single day.
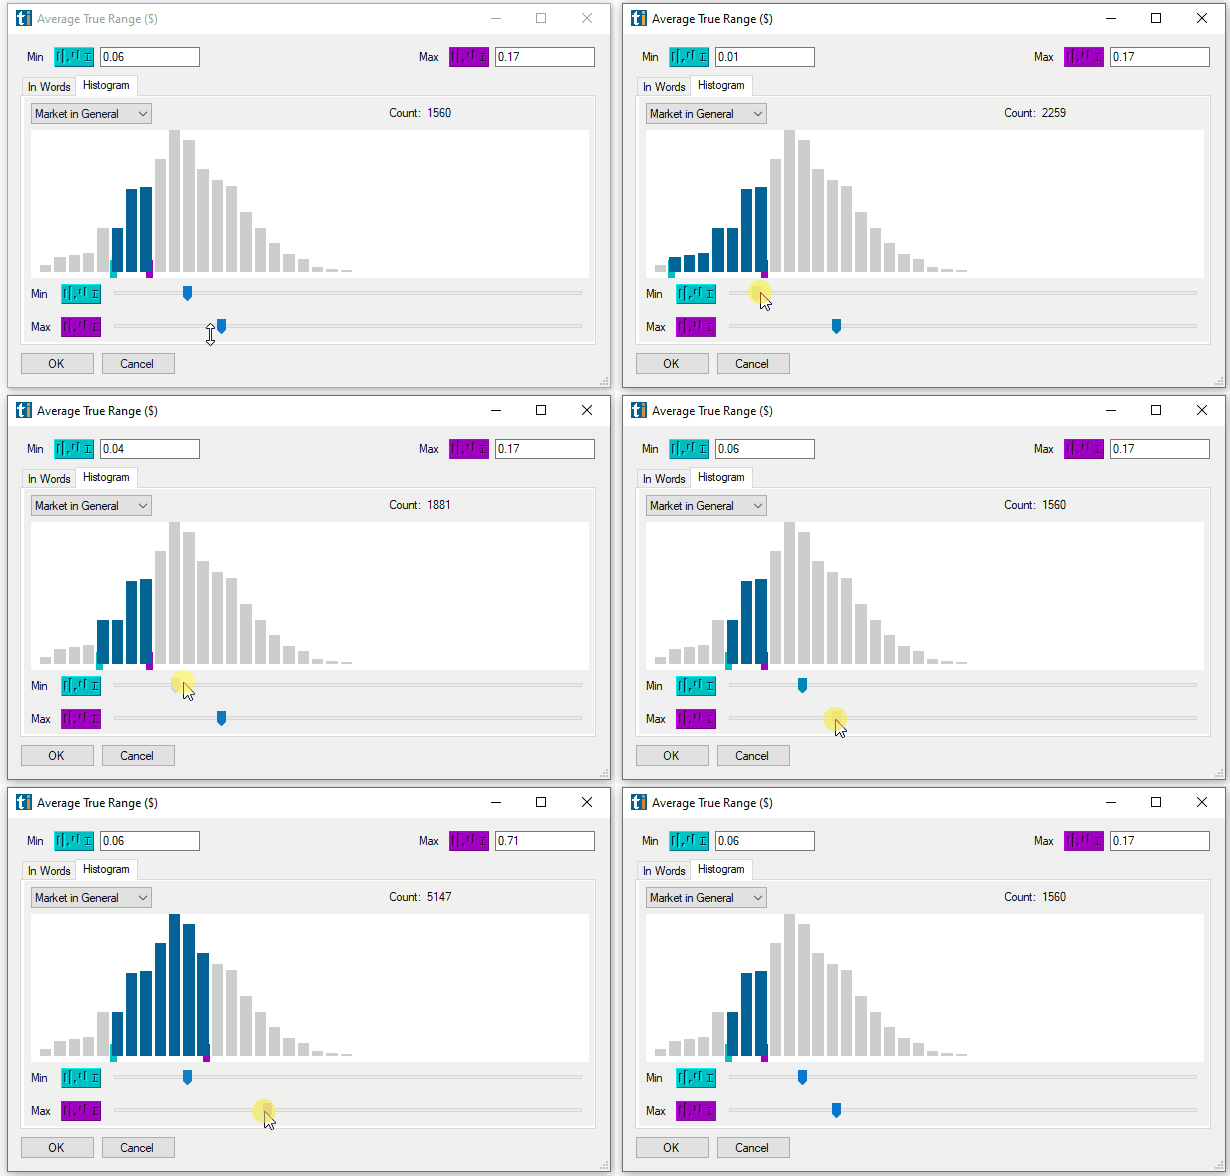
Suppose you are interested in alerts for stocks reaching new highs, but you only want to see these if the ATR is not too small.
You could pick a number out of thin air that “feels” right to you. However, a more sophisticated approach involves utilizing the Filter Histogram tool in Trade-Ideas. With this tool, you can instantly observe the range of ATR values, as well as identify the number of stocks you’d exclude by setting a particular minimum and/or maximum value for the ATR filter.

You can do this for every one of our hundreds of filters in Trade-Ideas.
This is a crucial step in my process of backtesting and creating my own profitable trading strategies. Using the histogram tool provides a systematic way to determine the precise points for rule application in my strategies to maximize profit.

Dave Mabe is a trader and the CTO at Trade-Ideas. He helps traders make more money by improving their strategies.
You can also sign up for Dave Mabe’s personal newsletter here: davemabe.com
