How I Nailed $FRX
How I Nailed $FRX
Dec 4, 2012
How I use a multifaceted approach to beat the average
In the last blog post we discussed how our brain will often lead us in the wrong direction when it comes to investing and trading the markets. In his book Blink, Malcolm Gladwell writes more about this topic and the term “rapid cognition.” Rapid Cognition is the process of making decisions and coming to conclusions in the blink of an eye.
We want to recognize patterns in stocks because it is in our nature. We want to quickly see a pattern that is familiar. Patterns that yield results are comforting and reinforcing. Similar to how a glimpse of a grizzly bear is immediately registered as a threat (big animal, sharp claws, run!).
There is a tremendous amount of literature written and marketed about what works in the markets. And most of it is completely wrong because the markets constantly evolve to process and discount information in different ways. There is no one right way. Philosophically speaking, in the markets, most of us ought to listen to our inner George Costanza and do the opposite of what we “think” is the right thing to do. It is much easier said than done however.
Nailing $FRX – Forest Labs at 32 dollars.
We walk the walk. Anyone who subscribes to Trade Ideas knows we built this technology first for ourselves. We, the partners at Trade Ideas, are investors and traders. We use our own money for research and development, a litmus test for how well we design the software.
Here is a snapshot of my current E*Trade portfolio (Figure 1):
| Figure 1: E*TRADE blotter. Note E*TRADE is a entreprise licensee of Trade Ideas technology in their Power E*TRADE Pro platform for active investors |
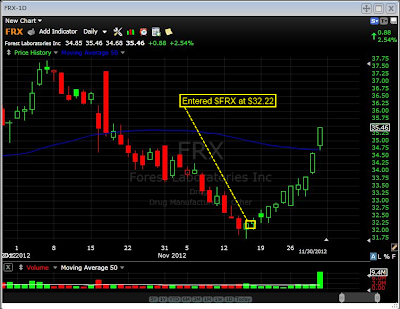
$FRX was the most recent addition to my portfolio. Here’s how I discovered it, why I made the trade/investment and why many of you did not. Figure 1 shows I went long $FRX on Nov 16th at $32.22. Technically it was looking pretty weak coming down quickly from October highs of $37. In fact $FRX may have been a technical breakdown candidate play as shown below in Figure 2.
 |
| Figure 2: Chart of $FRX |
I went long. First, I throw away cliches like “don’t pick bottoms,” “sell lower lows,” “buy higher highs,” “stay with the trend,” “overbought,” “oversold,” etc. They are anecdotal pieces of information and work unreliably. What I treat as gospel has nothing to do with technical patterns but rather with money management: “don’t lose big” and “don’t stay in losing trades a long time.” These are my cornerstones from which I make asset allocation decisions.
I scan for what the market is overlooking. I try to see both technical and fundamental information together because they tell more of the story. Thankfully this has recently been easier at Trade Ideas. New fundamental indicators help spot opportunities in a more optimal way. For $FRX I did a search for companies that make money, having the highest Estimated Annual Earnings Growth as shown in Figure 3:
| Figure 3: Top List results https://trade-ideas.54solutions.com/ |
What made $FRX stand out? Well it was number one on the list of Estimated Annual Earnings Growth (the last column, column 11, in Figure 3 that is indented), a high income to debt ratio, and one of the higher EPS (column 10) – all things that are good in general. Price action showed, however, a different story. At the time it was on 4 month lows, so I described my hypothesis and the risk picture as: If it breaks August lows, get out because obviously the thesis is not proving itself. Otherwise stay in the position and manage it opportunistically. So I took a chance, with my stops at lows below August lows. The rest is history.
Success is not the same for everyone. YMMV. I’m hoping to show how I use a multifaceted approach to try to beat the average and the average Joes 🙂
The strategy in the article above starts with the premise that stocks with positive estimated earnings are good candidates to buy on a pullback or breakdown. It turns out that recent research cited by Business Intelligence supports this strategy.
Drivers of total stock returns come from different sources. In his new 2013 market strategy report, LPL Financial’s Jeff Kleintop examines the main contributors of stock returns throughout market history and points to Earnings as its biggest driver since Q1 of 2009. Here is the chart below. Click on it to go to the full summary of the report.
 |
| Figure 4: Business Intelligence |
