10 Day Range
Table of Contents
- Understanding the 10 Day Range Percent Filter
- 10 Day Range Percent Filter Settings
- Using the 10 Day Range Percent Filter in Trading
- FAQs about 10 Day Range Percent
Understanding the 10 Day Range Percent Filter
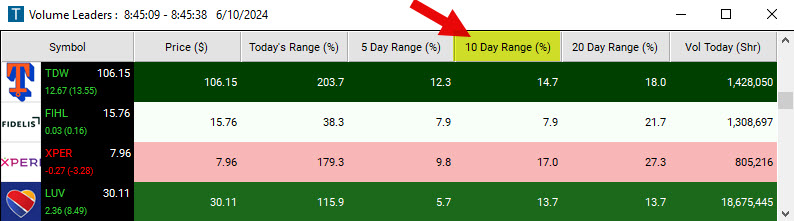
The 10 Day Range % Filter returns the difference between the highest and lowest prices a stock has traded within the previous 10 days as a percentage. It does not count the current day’s prices.
The exact formula is: (10d range($)/10d_low($)) x 100
As an example, if the 10 day range for a stock was $5, and the 10 day low was $25, then the 10 day range % would be 20%.
10 Day Range Percent Filter Settings
Activating the 10 Day Range (%) Filter is straightforward. You'll find its settings under the Window Specific Filters Tab in your Alert and Top List Configuration Window.
You can set a minimum and/or maximum value, and stocks that don't fit within your parameters are automatically excluded from your scan results.
-
To find stocks with a 10-Day Range of at least 5%, add the 10 Day Range (%) Filter to your scan and enter 5 in the minimum field in the Windows Specific Filters Tab.
-
To find stocks with a 10-Day Range of no more than 10%, add the 10 Day Range (%) Filter to your scan and enter 10 in the maximum field in the Windows Specific Filters Tab.
-
To find stocks with a 10-Day Range between 5% and 10%, add the 10 Day Range (%) Filter to your scan and enter 5 in the minimum field and 10 in the maximum field in the Windows Specific Filters Tab.
Using the 10 Day Range Percent Filter in Trading
The 10 Day Range Percent Filter is a useful tool for traders, particularly those employing strategies that capitalize on volatility or range-bound markets. Here's how traders might use this filter in their strategies:
- Identifying volatile stocks for short-term trades: Traders interested in short-term, high-risk trading such as day trading or swing trading can use this filter to identify stocks that have exhibited significant price movement over the past 10 days. By setting a high minimum value, traders can find stocks that have a wide range and are therefore potentially volatile.
- Identifying range-bound stocks for swing trading: The filter can also be used to identify stocks that have been trading within a certain range. By setting both a minimum and maximum value, traders can find stocks that are not too volatile but still exhibit enough price movement for profitable swing trades. Once identified, the trader can then use other analysis techniques to determine the best entry and exit points within the stock's trading range.
- Excluding overly volatile or flat stocks from scans: If a trader is looking for stable, moderately volatile stocks for a longer-term investment strategy, they could use this filter to exclude stocks that are too volatile or have little to no movement. Setting a maximum value would exclude stocks with high volatility, while setting a minimum value would exclude flat stocks.
- Sector comparison: Traders can also use this filter to compare the volatility of different sectors. By running scans for stocks within specific sectors and comparing the results, traders can identify which sectors are currently the most volatile. This information can be useful for sector-based strategies.
FAQs about 10 Day Range Percent
What is the purpose of the 10-day range % filter?
Traders use this filter to identify stocks that have experienced significant price fluctuations over the past ten trading days. It helps them identify potentially volatile stocks for trading opportunities.
How do I calculate the 10-day range %?
The 10-day range % is calculated by dividing the 10 day range ($) by the 10 day low ($) then multiplying by 100 to express as a percentage.
What threshold should I use for the filter?
The threshold for the filter depends on individual trading strategies and risk tolerance. Some traders may use a fixed percentage, such as 5% or 10%, while others may adjust it based on market conditions or the specific characteristics of the stocks they're trading.
How do I interpret stocks that meet the filter criteria?
Stocks that meet the filter criteria indicate higher volatility or significant price movements over the past ten days. Traders may further analyze these stocks to determine whether to buy, sell, or hold positions based on their trading strategies and risk management techniques.
Should I rely solely on the 10-day range % filter for trading decisions?
While the 10-day range % filter can be a useful tool for identifying volatile stocks, it's essential to combine it with other technical or fundamental analysis tools. Traders should consider multiple factors, such as trend analysis, volume, support and resistance levels, and market sentiment, to make well-informed trading decisions.
Filter Info for 10 Day Range [Range10DP]
- description = 10 Day Range
- keywords = Fixed Time Frame
- units = %
- format = 1
- toplistable = 1
- parent_code = Range5D